Abstract
Fourteen type crude oils originated from USA, Mexico, Africa, Middle East, Russia, Canada, Colombia, Ecuador, and Venezuela having density and sulfur in the range API = 12.1 ÷ 40.8; S = 0.4 ÷ 3.3% and total acid number varying in the range TAN = 0.1 ÷ 3.72 mg KOH/g oil have been investigated. The studied crude oils have been classified into four groups: I group – light, low sulfur one (30 – 40 ° API; S ≤ 0.5 % mass); ІІ group – light, sulfur one (30-40 °API; S= 0, 5 - 1.5 % mass); ІІІ group – heavy, high sulfur one (15-30 °API; S=1.5 ÷ 3.1% mass); ІV group – extra-heavy, high sulfur one (15 °API, S ≥3 % mass). It has been established that extra-heavy crude oils (IV group) are characterized by light fraction low content, diesel fractions low cetane index, vacuum gas oil fractions low K-factor and vacuum residue fractions high Conradson carbon content. It also has been found on the base of crude oil averaged prices for June 2009 (Brent crude oil price = 69 US $/ barrel) that the difference of the Ist and IVth group crude oil prices was about 9 US $/ barrel. This difference amounts up to 22 US $/ barrel, as the crude oil price rises up to 140 US $/ barrel. The high acid crude oil price (such having TAN > 0.5 mg KOH/g oil) may be approximately 9 US $/ barrel lower than one determined on the base of density and sulfur content for the corresponding group.
Key words: opportunity crudes, crude value, high acid crudes, crude oil quality
Introduction
Crude cost is the single most important determinant for the profitability of an oil company. With crude costs accounting for around 80% of the refinery expenditures, processing cheaper crudes can have a very positive impact on refinery margins.
For refineries that have freedom in crude choice, the selection of an optimum crude package is of vital importance. This requires intense teamwork between the trader and the supply/ manufacturing economist and typically linear-program (LP) models of individual refineries are routinely used to determine the relative use values among crudes. To achieve optimal crude selection and processing decisions, a refiner must have exact information refer to crude oil quality. This includes: crude oil TBP-curve as main data for correct operation of refinery crude oil atmospheric-vacuum distillation plants; the characteristics of crude oil fraction:
Naphtha fraction:
density, naphthenes and arene content, octane number, sulfur and metal as lead and arsenic content, affecting isomerization and reforming plants operation;
Kerosene fraction:
density, sulfur, pour point, freezing point, arene content (for aviation fuel); cetane index, low temperature properties (CFPP), pour point and diesel and fuel oil blending viscosity;
Diesel fraction:
density, sulfur, arene content, cetane index, pour point, low temperature properties (CFPP), diesel and fuel oil blending viscosity;
Heavy gas oil:
UOP “К” factor or hydrogen content, nitrogen and Conradson carbon quality characteristics of this fraction as feed for Fluid Catalytic Cracking and other conversion processes;
Atmospheric residue and vacuum gas oils:
density, pour point, sulfur, viscosity, metals for fuel oil blending; UOP “К” factor or content of hydrogen, nitrogen and Conradson carbon as suitability criteria for conversion processing (Fluid Catalytic Cracking and Hydrocracking)
Vacuum residue:
density, pour point, sulfur, viscosity, metals for fuel oil blending; UOP “К” factor or hydrogen, nitrogen and Conradson carbon content as suitability criteria for their processing by the conversion processes (Catalytic cracking and Hydrocracking).
In practice, data is also needed for additional cuts in order to generate property profiles as a basis for recutting to actual refinery straight-run products. For example: the increase demand of diesel in Europe drives the European refiners to cut naphtha fractions and in this way to increase diesel yield. This information may be obtained by use of standard laboratory test methods normally API or ASTM. One extensive laboratory analysis of crude oil may cost over 20 000 US $ and generally it takes two to four weeks. In practice it is extraordinary difficult and very expensive to carry out full laboratory analysis of every cargo crude oil received at the refinery. This has resulted in development of a number computing methods that permit prediction of petroleum fractions properties by routine laboratory analyses. These methods require information about petroleum fractions distillation characteristics, density, sulfur content, viscosity and refraction. This information may be obtained only after crude oil TBP distillation, analysis which duration is not less than 24 hours. Another important information of crude oil quality is organic acid content since organic acid presence at high concentration may generate number of problems at equipment operation and especially at crude oil atmospheric-vacuum distillation plants via their acid high corrosion activity. The crude oil total acid number is an indicator of the organic acids content in the crude oil. It is well known that problem crude oils are those which total acid number is over 0.5 mg KOH/g oil. But not always low acid number of crude oil feed means that it is not possible corrosion problem to occur due to the presence of naphthenic acids in definite petroleum fractions. Such cases exist when definite fraction has very low sulfur content and presence of organic acids. Sulfur presence result to formation of protective layer of ferric sulfide that renders difficult organic acid attack of the metal and by that manner the equipment accelerated corrosion is reduced. Because of lower prices of high acid crude oil feeds (total acid number over 0.5 mg KOH/g crude oil) their processing is one opportunity to increase crude oil processing profit after use of adequate programs for minimizing the risk of accelerated corrosion and subsequent equipment untimely, unplanned damage.
There are basically four types of crude available to refiners around the world. They are light-sweet (30-40 °API, <0,5 wt% S), light-sour (30-40 °API, 0.5-1.5 wt% S ), heavysour ( 15-30 °API, 1.5-3.1 wt% S) and extra-heavy (<15 °API and >3 wt% S ). High acid crude oils (HACs) represent the fastest-growing segment of global oil production.
California, Brasil, North Sea, Russia, China, India and West Africa are known to supply HACS. Over half of the world’s oil supply is heavy and sour. Hence, synthetic petroleum feeds derived from bitumen sands are considered as high acid ones. Table 1 represents comprehensive assay of fourteen crudes which belong to the four basic type petroleum feeds. The crude comprehensive assay of all investigated crude oils was obtained in the Lukoil Neftochim Research Laboratory. Price of the crudes was obtained from the Energy Information Agency (EIA) and this price was related to June 2009. These data show that for June month 2009 the average prices of four type basic petroleum feeds are as follow:
- І group – light low sulfur ones (30-40 °API; S ≤ 0.5 % mass) = 68.5 US $ / barrel
- ІІ group – light sulfur ones (30-40 °API; S=0,5 1.5 % mass) = 67.5 US $ / barrel
- ІІІ group – heavy, high sulfur (15-30 °API S=1.5 ÷ 3.1% mass) = 66.8 US $ / barrel
- ІV group – extra-heavy high sulfur (15 °API, S ≥3 % mass)= 60.0 US $ / barrel
Here in, it is seen that the price of light, low sulfur crude oil from Louisiana nevertheless of its low sulfur content and low density (High API) according to which itshould be applied to first group crude oils, is equal to that of the lowest quality crude oils of fourth group. This may be explained by the high acid number of the crude oil that in combination with low sulfur content means high corrosion reactivity and so unfavorable feed for processing. The price of EMERAUDE (origin – Congo) and TIA JUANA PESADO (origin Venezuela) crude oils is not included in Table 1 as they are not available on the market due to their extra high acid number. The crude oil light fraction (distilled up to 343 °C) content decreases in the following order: I group > II group > III group > IV group. Vacuum residue content decreases in reverse sequence. The average characteristics of the fractions derived from crude oil groups included in Table 1 show (Table 2) that IV group crude oil naphtha has the highest octane number and diesel fractions of the same crude oils have the lowest cetane number that corresponds to the conclusions drawn up by other authors.
Table 2 Average characteristics of the fractions derived from crude oils presented in Table 1
Vacuum gas oil fraction from group IV has the lowest K-factor and due to this at conversion processes from them will be produced the lowest yields of valuable products like naphtha, diesel fraction and C3 and C4 alkenes. The IV group crude oil vacuum residues have the highest Conradson carbon and so they are unfavorable feeds for catalytic conversion processes. They are suitable for processes like cocking at which as by product is produced low valuable coke. All of these characteristics show that from IV group crude oils may be produced the lowest yields of high valuable transport fuels.
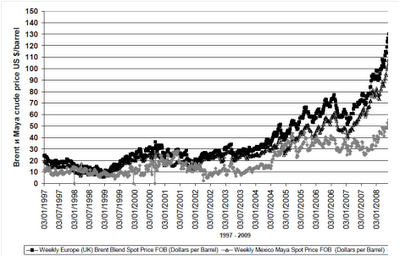
Similarly, they require higher costs for processing due to required high degree of upgrading at hydrotreating processes and higher consumption of high prices hydrogen. The difference in prices between group I and group IV crude oils has been 8.5 US $ / barrel on June 2009, but as a whole this difference depends on the crude oil price. The plot of Brent type crude oil price change for period 1997 – 2009 is shown on Figure 1. It may be seen from it that difference of prices between high quality crude oils (low density and low sulfur content) and low quality crude oils (high density and high sulfur content) increases along with the increase of crude oil price. For example at crude oil price of order 30 US $ / barrel the difference between Brent и Maya crude oils is about 30 US $ / barrel and at 140 US $ / barrel it is already 20 US $ / barrel. Hence, as higher is the crude oil price so more advantageous is to process low quality crude oils.
.png)
Figure 1 Crude Brent price and difference in prices of crudes Brent and Maya in the period 1997 - 2209 (Source: Energy Information Administration)
Conclusions
The following conclusions may be drawn up as a result of the carried out investigation:
1. The high quality crude oils (low density and low sulfur content) are characterized by light fractions high content, diesel fractions high cetane index, vacuum gas oils high Kfactor and vacuum residue fractions low Conradson carbon content.
2. Low quality crude oils (high density and high sulfur content) are characterized by light fractions low content, diesel fractions low cetane index, vacuum gas oils low K-factor and vacuum residue fractions high Conradson carbon content.
3. The difference between the high quality and low quality crude oils increases with the crude oils price growth.
4. At high crude oil prices the most profitable will be refineries having available heavy petroleum residues conversion plants that allow them to process low quality crude oils to high valuable transport fuels.
5. The high acid number and low sulfur content of crude oil results to its price decrease by about 9 US $/ barrel at crude oil price about 69 US $/ barrel.
6. It is proved the conclusion drawn up by other authors that high acid crude oil diesel fractions have low cetane index.
D. Stratiev, R.Dinkov, K. Petkov, K. Stanulov
Lukoil Neftochim Bourgas, 8010 Bourgas, Bulgaria University of Chemical Technology and Metallurgy - Sofia, 1756 Sofia, Bulgaria, e-mail stratiev.dicho@neftochim.bg

.png)


.png)
.png)
.png)
.png)
.png)


