Friday, August 3, 2012

API Oil-Water Separator


An API oil-water separator is a device designed to separate gross amounts of oil and suspended solids from the wastewater effluents of petroleum refineries, petrochemical and chemical plants, natural gas processing plants and other industrial sources.

The name is derived from the fact that such separators are designed according to standards published by the American Petroleum Institute (API).

Description of the design and operation

The API separator is a gravity separation device designed by using Stokes' Law to define the rise velocity of oil droplets based on their density and size. The design of the separator is based on the density difference between the oil and the wastewater because that difference is much smaller than the specific gravity difference between the suspended solids and water. Based on that design criterion: most of the suspended solids will settle to the bottom of the separator as a sediment layer, the oil will rise to top of the separator and the wastewater will be the middle layer between the water on top and the solids on the bottom.


Typically, the oil layer is skimmed off and subsequently re-processed or disposed of, and the bottom sediment layer is removed by a chain and flight scraper (or similar device) and a sludge pump. The water layer is sent to further treatment consisting usually of a dissolved air flotation (DAF) unit for further removal of any residual oil and then to some type of biological treatment unit for removal of undesirable dissolved chemical compounds.

Parallel plate separators are similar to API separators but they include tilted parallel plate assemblies (also known as parallel packs). The underside of each parallel plate provides more surface for suspended oil droplets to coalesce into larger globules. Any sediment slides down the topside of each parallel plate. Such separators still depend upon the specific gravity between the suspended oil and the water. However, the parallel plates enhance the degree of oil-water separation. The result is that a parallel plate separator requires significantly less space than a conventional API separator to achieve the same degree of separation.

History

The API separator was developed about 75 years ago by the API and the Rex Chain Belt Company. The first API separator was installed in 1933 at the Atlantic Refining Company (ARCO) refinery in Philadelphia. Since that time, virtually all of the refineries worldwide have installed API separators in their wastewater treatment plants. The majority of those refineries installed the API separators using the original design based on the specific gravity difference between oil and water. However, many refineries now use plastic parallel plate packing to enhance the gravity separation.

Other oil-water separation applications

There are other applications requiring oil-water separation. For example:
·    Oily water separators (OWS) for separating oil from the bilge water accumulated in ships as required by the international MARPOL Convention.
·     Oil and water separators are commonly used in electrical substations. The transformers found in substations use a large amount of oil for cooling purposes. Moats are constructed surrounding unenclosed substations to catch any leaked oil, but these will also catch rainwater. Oil and water separators provide a quick and easy cleanup of an oil leak

Share |

Capacity Loss due to Cubcooled Reflux Use

Sometimes feeds going to a distillation column are subcooled. One reason a feed may be subcooled is because during energy optimization of the plant the feed stream going to the column was identified as a source of heat that could be cross-exchanged with colder stream. Another reason is it may be advantageous to subcool the overhead product of a column at the condenser instead of using an additional product cooler. The biggest problem is that these factors are often not taken into account when sizing column internals. This may lead to a premature flooding, loss of column efficiency, and reduced capacity.

Excessive sub-cooling of a reflux feed to a distillation column can lead to a variety of operational problems. Excessive subcooling of a reflux feed condenses some of the internal vapor traffic. This, in turn, increases the liquid traffic in the affected area of the column (Figure 1). Often, the operations department will try to counter this by cutting back on the amount of reflux being introduced into the column or by adjusting the condenser duty. Reductions in reflux being introduced will have an effect on the effectiveness of the column.

Sub-cooling also reduces overall column efficiency. The subcooled reflux or feed shifts some of the internal equipment from a mass-transfer service to a heat-transfer service.

Subcooled Liquid Feed Mechanism
Sub-cooled liquid feed is at a temperature below its column-pressure bubble point. The effect of a subcooled feed or reflux can be estimated by:
LF        change in liquid flow at the feed stage
F          total moles of feed (reflux)
H          molar enthalpy of liquid feed at conditions to the column
h*         molar enthalpy of liquid feed at the column pressure boiling point
Heq        molar enthalpy of vapor which would exist in equilibrium with the feed if the liquid

feed were at the column pressure boiling point.
Referring to Figure 1, we see that LF equals L2-L1. When a sub-cooled liquid feed is used, the increase in liquid molar flow at the feed stage is greater than the liquid molar feed rate alone. Vapor rising to the feed stage is condensed in order to raise the feed conditions to the bubble point temperature. The condensing vapor increases the liquid flow leaving the feed stage, flooding the column (Figure 2.)

Operational Example
After a revamp of a commercial petrochemical column the column was started up and lined out. Operations brought the column up to the new design-operating rate. Before the column reached the new design-operating rate the column started to experience a loss of efficiency. The capacity of the column fell five to ten percent short of the design capacity. The column was gamma scanned and the scan revealed that the top five to six trays had an extremely high liquid level on the tray active area. The down comer also had an extremely high clear liquid back up. All of these conditions were consistent with a premature flooding condition.

A test run was performed to evaluate the column’s performance and to verify the design. The data collected from the test run was used to evaluate the model.

While reevaluating the model, it was discovered that 100°F (55ºC) subcooled reflux was being introduced into the column. The use of sub cooled reflux was missed during the design phase of the column revamp project. The simulation was rerun using the subcooled reflux conditions.

The results of the simulation indicated that the liquid traffic in the rectification section of the column was dramatically higher than previously used in the design. The internals were re-rated with the loadings from the simulation. It was determined that the column would get about five percent less capacity than planned. This was consistent with the results seen from the simulation and the gamma scan.

Sub-cooling the reflux was a normal part of the operation of the plant. The reflux was subcooled to make the plant more energy efficient. This practice could be abandoned if necessary. The operations group agreed to increase the temperature of the reflux in order to determine if this was the problem with the column. Once the reflux was introduced to the column at bubble point temperature, the capacity and efficiency of the column increased. The column was able to handle the new design-operating rate and the efficiency of the column was within design specifications.

Conclusions
The introduction of subcooled feed into a column may cause operational problems and lead to premature flooding. If a subcooled reflux feed is going to be used, the effects of this stream must be accounted for in the design of the column.


Share |

Friday, July 27, 2012

Flow Profile for Reciprocating Pumps


Reciprocating pumps are often used in the chemical process industries (CPI) because of their ability to generate high pressures at low velocities. A subcategory of positive-displacement pumps, reciprocating pumps act through the recipricating motion of a piston, plunger or diaphragm. Such pumps work by way of a connecting-rod-and-crank mechanism with a piston.

By nature, reciprocating pumps generate pulsing flow, which, when plotted as a function of time, or of crank angle, produces a curve that resembles a sine wave to a first approximation. For example, manufacturers of pulsation dampeners and surge suppressors often use sinusoidal curves for piston pumps and compressors in their product literature and sizing formulas. However, a closer examination of the flow profile for a piston-and-crank pump or compressor reveals the curve to be a significantly distorted sine wave because of the interaction between the crank and the connecting rod.

Calculating flowrate
In graphical form, the crank and crankshaft of a reciprocating pump can be visualized by placing the crankshaft center at the 90-deg mark of a 180-deg x-axis, and placing the crank bearing at the origin (see figure). A connecting rod links the crank to the piston.

Determining the position of the piston at any crank angle can be accomplished by measuring on a piston pump, compressor, or piston engine, or it can be calculated using trigonometric relationships.
The degree to which the actual flow profile curve deviates from the sinusoidal curve is determined by the ratio of the connecting rod length to the crankshaft length. Smaller values of the ratio translate into greater levels of distortion. As the connecting rod becomes very long, the flow profile would approach the sine curve .

To calculate the flowrate at a given crank angle, use the following procedure and definitions:

Crank length = OC
Piston rod length = CP
For any angle a, Line AC = OCsin (a)
Line SA = OC  OC cos (a)
Line AP = (CP2 – AC2)0.5
Line SP = AP + SA

1.     Calculate the piston position for two crank angles, perhaps 2 deg apart.
2.   The difference in piston positions equals piston displacement over the time interval between the two crank angles. The value is an average over the span of the two readings, not an instantaneous reading. As the step size approaches zero, displacement nears the true velocity.
3.    This value can be converted into flowrates (gal/min or other units) if the piston diameter and speed (revolutions per minute, rpm) are known.

Observations of the plot
In an illustrative example, plots of piston velocity versus crank angle are shown (see graph). The ratios of the connecting rod length to crank shaft length are 1.05 to 1 (blue line), 2 to 1 (red line) and 5 to 1 (green line). The following observations can be made:

1.    At the beginning of the discharge stroke, flowrate approaches zero asympotically, rather than as a sinusoidal curve
2.     Peak flowrates do not occur at the 90-deg point, but rather at 95–120 deg, depending on the ratio of rod length to crank length
3.     Peak flowrates are higher than would be predicted with a pure sine curve
4.     From 180 to 360 deg (the suction portion of the pump cycle), the curve mirrors the 0-to-180-deg portion
5.     Flowrates during the suction portion of the curve are also higher and occur earlier than the 270-deg point

Effects of distorted sine curve
Within the areas of fluid flow and mechanical pump design, there are a number of aspects that are affected by the deviation of flow profile from a perfect sine curve for pumps and compressors. The effects include the following:
       Check valves and passages will have higher-than-predicted peak flowrates and pressure drop will be higher, by the square of flowrate
   The higher flowrates and pressure drops will affect net positive suction head (NPSH) and possibly induce vaporization
    Maximum crank revolutions per minute will be lower than what would be allowed by the pure (non-distorted) sinusoidal curve
       Loads experienced by bearings will increase somewhat, especially in high-speed compressors
       Stress analysis of the connecting rods will be affected
       Surge dampeners must handle the sharper peak of a bell curve, rather than a smoother sine curve
       Multi-piston pumps and compressors would have less “smoothing” effect than would be predicted because the bell-shaped curve has a sharper peak

References
1.     McGuire, J.T., “Pumps for Chemical Processing,” Marcel Dekkar, New York, 1990.
2.     Henshaw, T.E., “Reciprocating Pumps,” Van Nostrand Reinhold Co., New York, 1987.
3.     Krugler, A., Piston Pumps and Compressors: Exploring the Flow Profile, Self-published, 2010.


Share |

Thursday, July 26, 2012

Evaluation of Crude Oil Quality


Abstract

Fourteen type crude oils originated from USA, Mexico, Africa, Middle East, Russia, Canada, Colombia, Ecuador, and Venezuela having density and sulfur in the range API = 12.1 ÷ 40.8; S =  0.4 ÷ 3.3%  and total acid number varying in the range TAN = 0.1 ÷ 3.72 mg KOH/g oil have been investigated. The studied crude oils have been classified into four groups: I group – light, low sulfur one (30 – 40 ° API; S ≤ 0.5 % mass); ІІ group – light, sulfur one (30-40 °API; S= 0, 5 - 1.5 % mass);  ІІІ group – heavy, high sulfur one (15-30 °API; S=1.5 ÷ 3.1% mass);  ІV group – extra-heavy, high sulfur one (15 °API, S ≥3 % mass). It has been established that extra-heavy crude oils (IV group) are characterized by light fraction low content, diesel fractions low cetane index, vacuum gas oil fractions low K-factor and vacuum residue fractions high Conradson carbon content. It also has been found on the base of crude oil averaged prices for June 2009 (Brent crude oil price = 69 US $/ barrel) that the difference of the Ist  and IVth  group crude oil prices was about 9 US $/ barrel. This difference amounts up to 22 US $/ barrel, as the crude oil price rises up to 140 US $/ barrel. The high acid crude oil price (such having TAN > 0.5 mg KOH/g oil) may be approximately 9 US $/ barrel lower than one determined on the base of density and sulfur content for the corresponding group.  
Key words: opportunity crudes, crude value, high acid crudes, crude oil quality

Introduction

Crude cost is the single most important determinant for the profitability of an oil company. With crude costs accounting for around 80% of the refinery expenditures, processing cheaper crudes can have a very positive impact on refinery margins.

For refineries that have freedom in crude choice, the selection of an optimum crude package is of vital importance. This requires intense teamwork between the trader and the supply/ manufacturing economist and typically linear-program (LP) models of  individual refineries are routinely used to determine the relative use values among crudes. To achieve optimal crude selection and processing decisions, a refiner must have exact information refer to crude oil quality. This includes: crude oil TBP-curve as main data for correct operation of refinery crude oil atmospheric-vacuum distillation plants; the characteristics of crude oil fraction: 

Naphtha fraction: 
density, naphthenes and arene content, octane number, sulfur and metal as lead and arsenic content, affecting isomerization and reforming plants operation; 

Kerosene fraction: 
density, sulfur, pour point, freezing point, arene content (for aviation fuel); cetane index, low temperature properties (CFPP), pour point and diesel and fuel oil blending viscosity; 

Diesel fraction:
density, sulfur, arene content, cetane index, pour point, low temperature properties (CFPP), diesel and fuel oil blending viscosity; 

Heavy gas oil:
UOP “К” factor or hydrogen content, nitrogen and Conradson carbon quality characteristics of this fraction as feed for Fluid Catalytic Cracking and other conversion processes;  

Atmospheric residue and vacuum gas oils: 
density, pour point, sulfur, viscosity, metals for fuel oil blending; UOP “К” factor or content of hydrogen, nitrogen and Conradson carbon as suitability criteria for conversion processing (Fluid Catalytic Cracking and Hydrocracking) 

Vacuum residue: 
density, pour point, sulfur, viscosity, metals for fuel oil blending; UOP “К” factor or hydrogen, nitrogen  and Conradson carbon content as suitability criteria for their processing by the conversion processes (Catalytic cracking and Hydrocracking).

In practice, data is also needed for additional cuts in order to generate property profiles as a basis for recutting to actual refinery straight-run products. For example: the increase demand of diesel in Europe drives the European refiners to cut naphtha fractions and in this way to increase diesel yield. This information may be obtained by use of standard laboratory test methods normally API or ASTM. One extensive laboratory analysis of crude oil may cost over 20 000 US $ and generally it takes two to four weeks. In practice it is extraordinary difficult and very expensive to carry out full laboratory analysis of every cargo crude oil received at the refinery. This has resulted in development of a number computing methods  that permit prediction of petroleum fractions properties by routine laboratory analyses. These methods require information about petroleum fractions distillation characteristics, density, sulfur content, viscosity and refraction. This information may be obtained only after crude oil TBP distillation, analysis which duration is not less than 24 hours. Another important information of crude oil quality is organic acid content since organic acid presence at high concentration may generate number of problems at equipment operation and especially at crude oil atmospheric-vacuum distillation plants via their acid high corrosion activity. The crude oil total acid number is an indicator of the organic acids content in the crude oil. It is well known that problem crude oils are those which total acid number is over 0.5 mg KOH/g oil. But not always low acid number of crude oil feed means that it is not possible corrosion problem to occur due to the presence of naphthenic acids in definite petroleum fractions. Such cases exist when definite fraction has very low sulfur content and presence of organic acids. Sulfur presence result to formation of protective layer of ferric sulfide that renders difficult organic acid attack of the metal and by that manner the equipment accelerated corrosion is reduced. Because of lower prices of high acid crude oil feeds (total acid  number over 0.5 mg KOH/g crude oil) their processing is one opportunity to increase crude oil processing profit after use of adequate programs for minimizing the  risk of accelerated corrosion and subsequent equipment untimely, unplanned damage.

There are basically four types of crude available to refiners around the world. They are light-sweet (30-40 °API, <0,5 wt% S), light-sour (30-40 °API, 0.5-1.5 wt% S ), heavysour ( 15-30 °API, 1.5-3.1 wt% S) and extra-heavy (<15 °API and >3 wt% S ). High acid crude oils (HACs) represent the fastest-growing segment of global oil production.

California, Brasil, North Sea, Russia, China, India and West Africa are known to supply HACS.  Over half of the world’s oil supply is heavy and sour. Hence, synthetic petroleum feeds derived from bitumen sands are considered as high acid ones. Table 1 represents comprehensive assay of fourteen crudes which belong to the four basic type petroleum feeds. The crude comprehensive assay of all investigated crude oils was obtained in the Lukoil Neftochim Research Laboratory. Price of the crudes was obtained from the Energy Information Agency (EIA) and this price was related to June 2009. These data show that for June month 2009 the average prices of four type basic petroleum feeds are as follow: 
-         І group – light low sulfur ones (30-40 °API; S ≤ 0.5 % mass) = 68.5 US $ / barrel
-         ІІ group – light sulfur ones (30-40 °API; S=0,5  1.5 % mass) = 67.5 US $ / barrel
-         ІІІ group – heavy, high sulfur (15-30 °API S=1.5 ÷ 3.1% mass) = 66.8 US $ / barrel
-         ІV group – extra-heavy high sulfur (15 °API, S ≥3 % mass)= 60.0 US $ / barrel 

Here in, it is seen that the price of light, low sulfur crude oil from Louisiana nevertheless of its low sulfur content and low density (High API) according to which itshould be applied to first group crude oils, is equal to that of the lowest quality crude oils of fourth group. This may be explained by the high acid number of the crude oil that in combination with low sulfur content means high corrosion reactivity and so unfavorable feed for processing. The price of EMERAUDE (origin – Congo) and TIA JUANA PESADO (origin Venezuela) crude oils is not included in Table 1 as they are not available on the market due to their extra high acid number. The crude oil light fraction (distilled up to 343 °C) content decreases in the following order: I group > II group > III group > IV group. Vacuum residue content decreases in reverse sequence. The average characteristics of the fractions derived from crude oil groups included in Table 1 show (Table 2) that IV group crude oil naphtha has the highest octane number and diesel fractions of the same crude oils have the lowest cetane number that corresponds to the conclusions drawn up by other authors.

Table 2 Average characteristics of the fractions derived from crude oils presented in Table 1

Vacuum gas oil fraction from group IV has the lowest K-factor and due to this at conversion processes from them will be produced the lowest yields of valuable products like naphtha, diesel fraction and C3 and C4 alkenes. The IV group crude oil vacuum residues have the highest Conradson carbon and so they are unfavorable feeds for catalytic conversion processes. They are suitable for processes like cocking at which as by product is produced low valuable coke. All of these characteristics show that from IV group crude oils may be produced the lowest  yields of high valuable transport fuels.

Similarly, they require higher costs for processing due to required high degree of upgrading at hydrotreating processes and higher consumption of high prices hydrogen. The difference in prices between group I and group IV crude oils has been 8.5 US $ / barrel on June 2009, but as a whole this difference depends on the crude oil price. The plot of Brent type crude oil price change for period 1997 – 2009 is shown on Figure 1. It may be seen from it that difference of prices between high quality crude oils (low density and low sulfur content) and low quality crude oils (high density and high sulfur content) increases along with the increase of crude oil price. For example at crude oil price of order 30 US $ / barrel the difference between Brent и Maya crude oils is about 30 US $ / barrel and at 140 US $ / barrel it is already 20 US $ / barrel. Hence, as higher is the crude oil price so more advantageous is to process low quality crude oils.
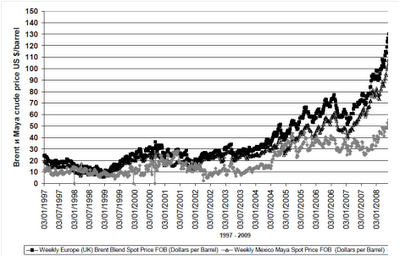
Figure 1 Crude Brent price and difference in prices of crudes Brent and Maya in the period 1997 - 2209 (Source: Energy Information Administration)

Conclusions

The following conclusions may be drawn up as a result of the carried out investigation: 
1.    The high quality crude oils (low density and low sulfur content) are characterized by light fractions high content, diesel fractions high cetane index, vacuum gas oils high Kfactor and vacuum residue fractions low Conradson carbon content.  
2.    Low quality crude oils (high density and high sulfur content) are characterized by light fractions low content, diesel fractions low cetane index, vacuum gas oils low K-factor and vacuum residue fractions high Conradson carbon content. 
3.     The difference between the high quality and low quality crude oils increases with the crude oils price growth. 
4.   At high crude oil prices the most profitable will be refineries having available heavy petroleum residues conversion plants that allow them to process low quality crude oils to high valuable transport fuels. 
5.     The high acid number and low sulfur content of crude oil results to its price decrease by about 9 US $/ barrel at crude oil price about 69 US $/ barrel. 
6.     It is proved the conclusion drawn up by other authors that high acid crude oil diesel fractions have low cetane index. 

D. Stratiev, R.Dinkov, K. Petkov, K. Stanulov
Lukoil Neftochim Bourgas, 8010 Bourgas, Bulgaria University of Chemical Technology and Metallurgy - Sofia, 1756 Sofia, Bulgaria, e-mail stratiev.dicho@neftochim.bg

Share |

Monday, July 2, 2012

Merits of Hydrogen Production/Consumption Optimization for a Hydrocracking-Reforming Complex

For many refiners, the hydrocracking unit is a key component in refinery optimization. Proper selection of catalysts for this unit is critical but not often straightforward.

For hydrocracking units where the most important product is gasoline, catalyst selection decisions are complicated by hydrogen utilization issues. The traditional logic for selecting hydrocracking catalysts based on activity, stability, yield pattern and cost may not provide an optimum solution if the decision-maker’s view is confined only to the hydrocracking unit. If the optimization calculations are based only on this unit, yield improvements achieved through volume swell could incorrectly influence the decisions.

Most hydrocracking units which produce maximum naphtha product slates, operate in conjunction with a reforming unit. UOP has found it very useful to consider the combined reformer/hydrocracking unit performance when designing hydrocracking catalyst configurations for these refiners. The results of this type of optimization are interesting and sometimes surprising.

Our analysis has shown that judgements must include consideration of hydrocracking unit yields and product quality plus reformer severity. If heavy naphtha aromatics saturation increases in the hydrocracking unit, required severity and resulting yields from the reforming unit are impacted. To some extent, hydrogen is being added to this fraction in one unit and the severity in the reformer must be increased to remove the added hydrogen.

Relative to the base case, saturation of the heavy naphtha shows significant negative impacts on octane barrels for cases where the there was no gain in heavy naphtha yield or where the gain in heavy naphtha was offset by decreases in light naphtha. A positive result is seen only when the gain in heavy naphtha is offset by butane and lighter losses.

Optimization for all aspects of refining is becoming more and more critical. As an important component in the overall optimization, catalyst selection for hydrocracking units will achieve the highest value for the refiner if the reformer/hydrocracking complex is taken into consideration as a whole. So, delivering this broad-scope optimized solution requires both catalyst and process expertise.

by Don Ackelson, Catalysts and Advanced Materials

Share |

Share

Twitter Delicious Facebook Digg Stumbleupon Favorites